Drawing Animation Levels
In OpenToonz it is possible to create and draw Toonz Vector levels (PLI format), Toonz Raster levels (TLV format) and standard Raster levels (TIF format) directly in the viewer. Drawing tools can also be used for touch-up in cleaned up drawings, and loaded raster images.
Drawing In OpenToonz
To draw an animation level, first you have to define its type: Toonz Vector, Toonz Raster or Raster; and its settings like its name, the number of frames it's made of and the way its drawings are numbered.
Toonz Vector levels are defined by drawing of vector strokes; strokes and areas defined by strokes can be painted by using the styles available in the level palette. Toonz Vector levels have an unlimited size and resolution, as they are vector-based. They are saved as PLI files.
Toonz Raster levels are defined by drawing bitmap lines; lines and areas defined by lines can be painted by using the styles available in the level palette. Toonz Raster levels have a specified size and resolution, defined when they are created. They are saved as TLV files.
Raster levels are defined by drawing bitmap lines using the styles available in the Raster Drawing Palette, that is shared by all of the Raster levels of the same project (see Project Default Folders ). Raster levels have a specified size and resolution, defined when they are created. They are saved as sequences of individual TIF files, one per level frame.
When an animation level is defined, you can select any of its frames in the Xsheet/Timeline or in the Level Strip, and start drawing in the viewer. You can do this both, when you want to create a drawing from scratch, and when you want to edit a previously made drawing.
When selected in the Xsheet/Timeline, the viewer displays the whole scene content at the current frame; when selected in the Level Strip, the viewer displays the selected frame of the current animation level only, to let you work more easily on it.
Setting the Default Type of Level to Draw
It's possible to define the default level type that will be created when you draw inside OpenToonz.
By default Toonz Vector and Toonz Raster levels are saved in the +drawing folder of the current project when the scene is saved, while Raster levels are saved in the +extras folder (see Project Default Folders ).
ちなみに
To define the Default Type of Level to Draw:
- Open File → Preferences... → Drawing.
- Choose the level type you want to use as default from the Default Level Type: option menu. Width, Height and DPI fields are available for Toonz Raster Level and Raster Level options.
注釈
The Width, Height and DPI values set in the File → Preferences... → Drawing section will also be used as default for the New Level dialog.
Drawing Animation Levels
Animation levels can be created in the following ways:
- Using the New Level dialog.
- Setting the Autocreation option to Enabled.
- Setting the Autocreation option to Use Xsheet as Animation Sheet.
Using the New Level Dialog
New animation levels can be defined by using a dialog that lets you set the number of drawings the level is made of, the animation step used to expose the frames in the Xsheet/Timeline, and the increment, that sets the way the level drawings are numbered. For example, a Step 2 repeats each drawing twice in the Xsheet column or Timeline layer, while an Increment 2 will number its drawings as 1, 3, 5, etc. The dialog also allows you to choose a destination folder, different from the default one, by using the Save In field.
In case you define a Toonz Raster or a Raster level, you can set its Width, Height and DPI values, according to the way you want to use it in the scene.
Settings like the length of the level and the numbering order can be edited later, as you are free to arrange the images composing an animation level the way you prefer (see Editing Animation Levels ).
When a new level is created in an empty column, the color of that column header and the cells where the new level gets exposed are colored denoting the type of level: light yellow for Toonz Vector levels, light green for Toonz Raster levels, and light blue for Raster levels (see Working with Xsheet Columns ).
注釈
The New Level dialog inherits the Default Level Type settings defined in Preferences... → Drawing.
ちなみに
To create a new animation level to draw:
- Do one of the following:
- Select a cell in the Xsheet/Timeline where you want to place your animation level and choose Level → New → New Level...
- Right-click the cell in the Xsheet/Timeline where you want to place your animation level and choose New Level... from the menu that opens.
- (If the Xsheet/Timeline toolbar is visible) Click any of the three New Level buttons at the leftmost part of it.
- Choose the type of level: Toonz Vector, Toonz Raster or Raster, from the Type: option menu and define its settings, then click the OK button.
注釈
When using the Xsheet/Timeline's toolbar buttons to create a new level, the corresponding level type is already preselected in the dialog's dropdown menu.
注釈
If a level is already exposed in the cell column, the new level will be created in an empty column.
ちなみに
To define the saving location for the level you want to draw:
In the New Level dialog type in the Save In: field, or use the Browser button, to set the path for the saving location.
注釈
If in the browser you choose any project folder, in the path field the full path will be replaced by the correspondent folder alias (see Project Default Folders ).
Using the Autocreation Option
When in Preferences → Drawing the Autocreation: option is set to Enabled, it is possible to create new drawings automatically by using drawing tools in the viewer. If the currently selected cell is empty, a new level will be automatically created and named with the first available letter of the alphabet; if the currently selected cell is the one right after one containing a level drawing (either in the Xsheet/Timeline or the Level Strip) a new drawing will be added to that level.
注釈
The level type will be the one defined in Preferences... → Drawing as Default Level Type.
Using the Xsheet as Animation Sheet
When in Preferences... → Drawing the Autocreation: option is set to Use the Xsheet as Animation Sheet, it's possible to create new drawings automatically by using drawing tools in the viewer. If the currently selected cell is empty and belongs to an empty column, a new level will be automatically created and named with the first available letter of the alphabet; if the currently selected cell is anywhere after one containing a level drawing, a new drawing will be added to that level. In both cases the drawings will take its number from the scene current frame ; if that drawing number already existed in the level, a letter will be added to its number (e.g. A.0001a.ext).
This working method allows you to work as a traditional animator: you can start creating the key drawings, and then add breakdown drawings, and then inbetween drawings. You can quickly check your animation flipping it in the viewer.
When you add a new drawing it will be repeated as a hold along the column/layer up to the following one.
It's also possible to create a new drawing in a cell that contains a hold: the new drawing will replace the hold up to the following drawing. Drawings can also be duplicated creating a copy with a different number.
Once the animation is completed you can renumber the whole sequence according to the Xsheet/Timeline frame numbering.
注釈
The level type will be the one defined in Preferences... → Drawing as Default Level Type.
ちなみに
To create a new animation level
Click an empty cell in the Xsheet/Timeline and start drawing using a drawing tool in the viewer.
ちなみに
To add a drawing to an existing level
Click an empty cell in the column/layer containing the existing level and start drawing using a drawing tool in the viewer.
ちなみに
To automatically renumber the drawings
- Select the cells with the drawings you want to renumber.
- Choose the Cells → Autorenumber command.
注釈
The Autorenumber command is also available in the menu that opens when right-clicking in a cell.
Using the Viewer
In the viewer, it's possible to use the tools available in the toolbar to draw, paint, edit and model drawings. The work area of the viewer is endless and you can scroll, zoom in, zoom out and rotate it.
In the title bar you can find information about what is currently displayed and selected, the zoom percentage, and a set of buttons that lets you set the view mode (see Using the Viewer ).
At the bottom of the viewer another customizable set of buttons is available.
The frame bar and the playback buttons let you set the current frame and move through animation frames. The set frame rate is visualized, and, in case the playback is activated, the actual frame rate is displayed on its left.
The other buttons are relevant only using the Animate tool ( ) to animate objects and when previewing the animation in the viewer (see Animating Objects and Previewing the Animation ).
注釈
If the bottom bar is too short to display all the options, it can be scrolled by using arrow buttons available at its ends.
注釈
In case a frame range is defined by playback markers, the playback buttons operate on the defined range only (see Using the Playback Markers ).
ちなみに
To navigate the work area:
Do one of the following:
- Use the Zoom tool (
 ): to zoom in, click and drag up; to zoom out, click and drag down. The point where you click is the center of the zooming action.
 - Use the zoom shortcut keys (by default + and - keys) to zoom in and zoom out at specific steps (e.g. 50%, 100%, 200%, etc.).
- Use the mouse wheel to zoom in and zoom out.
- Middle-click and drag or use the Hand tool (
 ) to scroll in any direction.
 - Use the Rotate tool (
 ) to rotate the viewer: an horizon line is displayed to let you understand the amount of rotation; the center of rotation is the absolute center of the work area.
 - Use the reset view shortcut (by default the Alt + 0 key) or right-click in the viewer and select Reset View from the menu that opens, to display the viewer at its actual size, centered on the absolute center with no rotation applied.
- Right-click and choose Fit to Window to automatically zoom the viewer so that it fits the camera box.
ちなみに
To play the scene contents back:
Do one of the following:
- Use the Play button.
- Drag the frame bar cursor.
ちなみに
To set the current frame:
Do one of the following:
- Use the playback buttons.
- Drag the frame bar cursor.
- Type in the Current Frame field the number of the frame you want to view.
ちなみに
To set the playback frame rate:
Do one of the following:
- Enter a value in the FPS field.
- Use the frame rate slider.
Adjusting the Viewer Visualization
The way the viewer visualizes the scene content can be adjusted according to the task to perform.
Full Screen mode can be entered to maximize the viewer to the monitor screen, hiding any interface window border. This is available only on the Windows platform.
Vector drawings, that can slow down the visualization performance when used in large amounts in a scene, can be visualized as raster drawings, faster to visualize, still preserving their vector nature, by using the Visualize Vector As Raster option.
注釈
If the current level is vector-based, it will still be displayed as vector to allow any drawing/editing operation you may perform.
Raster drawings and images that usually are displayed in the viewer according to their DPI value, can be displayed at their actual pixel size, that is to say that one pixel from the image is displayed as one pixel of the screen monitor, to better examine them.
注釈
Visualizing an image at its actual pixel size is different from zooming in because zooming always takes into account the image DPI information.
ちなみに
Windows only - To enter the viewer full screen mode:
Right-click the viewer and choose Full Screen Mode from the menu that opens.
ちなみに
Windows only - To exit the viewer full screen mode:
Right-click the viewer and choose Exit Full Screen Mode from the menu that opens.
ちなみに
To activate or deactivate the raster visualization for vector drawings:
Activate or deactivate the View → Visualize Vector As Raster option.
ちなみに
To display raster drawings and images at their actual pixel size:
- In the Xsheet/Timeline select the level to which the drawing or image belongs so that it becomes the current level.
- Select the drawing or image in the Level Strip in order to display it alone.
- Use the Actual Pixel Size shortcut (by default the N key) or right-click in the viewer and choose Actual Pixel Size from the menu that opens.
Customizing the Viewer
The Viewer can be customized according to your needs: the background colors visible in the Viewer and inside the camera box can be changed; a Field Guide and a Safe Area can be displayed for reference; the Table and Camera Box can be hidden; Custom Guides can be added to help you in aligning objects or composing the elements of the scene for a particular frame. The View → Inks Only check allows to hide the painted areas of the levels, facilitating the drawing process.
The set of buttons and information available in the bottom bar of the Viewer can be customized as well, so that only the elements you require are visible.
ちなみに
To change the Viewer Background color:
- Open the File → Preferences... → Colors dialog.
- Define the Viewer BG Color by doing one of the following:
- Set the Red, Green and Blue values.
- Click the color thumbnail and use the Style Editor to edit it (see Plain Colors ).
ちなみに
To change the Camera Box Background color:
- Open the Xsheet → Scene Settings... dialog.
- Define the Camera BG Color by doing one of the following:
- Set the Red, Green, Blue and Alpha values.
- Click the color thumbnail and use the Style Editor to edit it (see Plain Colors ).
ちなみに
To show or hide the Table:
Choose View → Table to show or hide the table.
ちなみに
To show or hide the Camera Box:
Choose View → Camera Box to show or hide the camera box.
ちなみに
To show or hide the Camera Background color:
Choose View → Camera BG Color to show or hide the camera box background color.
ちなみに
To show or hide the Field Guide:
Choose View → Field Guide to show or hide the field guide.
ちなみに
To define the displayed Field Guide:
- Open the Xsheet → Scene Settings... dialog.
- Define the Field Guide Size: and A/R:. Size is the number of width fields of the field guide (1 field is equal to 1 inch), and the A/R is the ratio between the field guide width and height.
ちなみに
To show or hide the Safe Area:
Choose View → Safe Area to show or hide the safe area.
ちなみに
To add a Custom Guide:
Click in the ruler: a click in the horizontal ruler will create a vertical guide, a click in the vertical ruler will create an horizontal guide.
ちなみに
To move a Custom Guide:
Drag the custom guide marker in the ruler.
ちなみに
To delete a Custom Guide:
Do one of the following:
- Right-click on the guide marker in the ruler.
- Drag its marker outside of the Viewer, in the opposite direction of the guide itself.
ちなみに
To show or hide Custom Guides:
Choose View → Guides to show or hide the guides.
ちなみに
To show or hide the Rulers where Custom Guide markers are located:
Choose View → Rulers to show or hide the rulers.
注釈
When the Viewer work area is rotated, guides are rotated as well, but rulers and guide markers will preserve their position and orientation. However the position of a guide will still be controlled by markers, even if they visually don’t match anymore.
ちなみに
To customize the set of buttons in the bottom bar of the viewer:
Click the option button ( ) on the far left of the bottom area, and select the elements to show, or deselect those to hide, in the menu that opens.
Drawing Tools
You can draw by using the Brush ( ) and Geometric (
 ) tools. For both tools you can set the thickness of the line you are going to draw: values range from 0 to 100 for Toonz Vector levels, and from 1 to 100 for Toonz Raster and Raster levels.
注釈
For Toonz Raster and Raster levels it's possible to set a Brush tool size higher than 100 by typing it in the Size value fields.
注釈
Min and Max Size/Thickness can be modified by either of these methods:
- Pressing Ctrl + Alt and moving the mouse. Moving horizontally changes the Max value, while moving vertically changes the Min value.
- Using the predefined keyboard shortcuts. U and I for respectively decreasing and increasing the Max value, or H and J for respectively decreasing and increasing the Min value.
With the Brush tool (), you can take full advantage of the pressure sensitivity if you are using a pressure sensitive tablet. The more you press on the tablet, the thicker the line you draw.
With the Geometric tool (), the thickness value is constantly applied to the whole shape you draw.
When creating vector drawings the size/thickness can also be set to 0 (zero): in this case vector strokes will only exist as a wireframe even if you zoom in or zoom out, and they will be not visible when the animation is rendered.
注釈
For vector drawings, line thickness can be changed and tweaked afterwards by using other tools (see Editing Drawings ).
Drawing with the Brush Tool
The Brush tool () allows you to draw freehand lines with the current style.
When using a pressure sensitive tablet, and the Pressure option is activated, varying the pressure of the pen on the tablet will allow you to create variable-thickness lines that will make your drawings more expressive.
When using the Brush tool () on Toonz Raster and Raster drawings, the cursor displays the exact pixel area that will be affected by the brush: the inner jagged circle representing the Minimum Size, and the outer one the Maximum Size of the brush.
In the tool options bar you can set the following:
- Size Min and Max sets the size of the brush; the size will vary between the two values if you're using a pressure sensitive tablet. If the two values are the same, your lines will have a constant thickness. When using a mouse to draw, the Maximum thickness value will be used.
- Accuracy sets how accurate the generated line is compared to what you draw with the mouse or tablet pen: a high value will generate lines that completely preserves the movement you perform (even a trembling hand); a low value will simplify the line. This is available for Toonz Vector drawings only.
- Smooth allows for stroke stabilization while drawing. This is available for Toonz Vector and Toonz Raster drawings only.
- Hardness sets the amount of antialiasing along the line border. This is available for Toonz Raster and Raster drawings only.
- Opacity Min and Max sets the opacity of the brush; the opacity will vary between the two values if you're using a pressure sensitive tablet. Overlapping areas are not considered while drawing a single line, but only when different lines are overlapping. This is available for Raster drawings only.
- Break automatically breaks the drawn stroke into sections, if very sharp angles are drawn: in this way, drawn shapes may result simpler and easier to fill. This is available for Toonz Vector drawings only.
- Draw Order allows to choose how new drawings will be ordered with respect to already drawn lines. The options are: Over All, Under All and Palette Order. When using Palette Order new lines will be drawn above or below already existing ones, using the relative indexes of the palette Styles as the sorting factor. This is available for Toonz Raster drawings only.
- Pencil mode draws lines without antialiasing, that is with jagged edges. This is available for Toonz Raster drawings only.
- Pressure detects, in case you are using a graphic tablet, the pressure of the pen on the tablet, allowing the creation of variable-thickness lines.
- Range allows for the automatic creation of a series of in-between strokes, by drawing just the extremes of the animation on subsequent frames of a level, in the Level Strip, or subsequent exposed cells of a level in the Xsheet/Timeline. By pressing Ctrl key, you can draw intermediate strokes to form a more complex animation sequence. This method is similar to the one used by the Inbetween command (see Using the In-betweener with Vector Drawings ). This is available for Toonz Vector drawings only.
- Snap allows for the snapping of the cursor to other already drawn strokes of the same level, while drawing a new stroke. It has three levels of sensitivity: Low, Med and High. This is available for Toonz Vector drawings only.
- Preset: let you choose a brush preset in the option menu on the right. You can add or remove a preset clicking the + and - buttons. A presets list is created for each level type and each added preset will be available for next use.
- Cap option sets the shape of the ends of the stroke you are going to draw. Options are Butt for squared ends, Round for semicircular ends, and Projecting for squared ends extending beyond the end of the line, according to the vector thickness. This is available for Toonz Vector drawings only.
- Join option sets the shape of the straight corners along the stroke you are going to draw. Options are Miter for pointed corners, Round for rounded corners, Bevel for squared corner. This is available for Toonz Vector drawings only.
- Miter: sets the maximum length of a miter join, that is computed multiplying the miter value by the stroke thickness. If the length exceeds the maximum value, the Miter join is turned into a Bevel join. This is available for Toonz Vector drawings only, and only if the Join option is set to miter.
注釈
If the tool options bar is too short to display all the tool options, it can be scrolled by using arrow buttons available at its ends.
ちなみに
To add a new brush preset:
- Click the + button on the right of the presets list.
ちなみに
To remove a new brush preset:
- Click the - button on the right of the presets list.
Drawing with the Geometric Tool
The Geometric tool () allows you to draw rectangles, circles, ellipses, regular polygons, polylines and arcs.
In the tool options bar you can set the following:
- Thickness sets the size of the brush used to draw the geometric shapes.
- Hardness sets the amount of antialiasing along the shape border. This is available for Toonz Raster and Raster drawings only.
- Opacity sets the opacity of the shape border. Overlapping areas are not considered while drawing over the same shape, but only when different shapes are overlapping. This is available for Raster drawings only.
- Shape: sets the type of shape you want to draw. Available options are: Rectangle, Circle, Ellipse, Line, Polyline, Arc and Polygon. In case you want to draw a Polygon, the Polygon Sides: lets you set the number of sides.
- Auto Group automatically defines any drawn closed shape (i.e. rectangles, circles, ellipses, polygons and closed polylines) as a group, thus creating a new layer that is placed in front of the other drawing vectors, without intersecting them (see Grouping and Ungrouping Vectors ). This is available for Toonz Vector drawings only.
- Auto Fill automatically paints the area defined by any drawn closed shape (i.e. rectangles, circles, ellipses, polygons and closed polylines) with the same style used for drawing. This is available for Toonz Vector drawings only.
- Snap allows for the snapping of the cursor to other already drawn strokes of the same level, while drawing the shape. It has three levels of sensitivity: Low, Med and High. This is available for Toonz Vector drawings only.
- Selective allows the drawing operations not to affect already drawn lines. This is available for Toonz Raster drawings only.
- Pencil mode draws geometric shapes without antialiasing, that is with jagged edges. This is available for Toonz Raster drawings only.
- Cap option sets the shape of the ends of open shapes you are going to draw. Options are Butt for squared ends, Round for semicircular ends, and Projecting for squared ends extending beyond the end of the line, according to the vector thickness. This is available for Toonz Vector drawings only.
- Join option sets the shape of the straight corners along the shapes you are going to draw. Options are Miter for pointed corners, Round for rounded corners, Bevel for squared corner. This is available for Toonz Vector drawings only.
- Miter: sets the maximum length of a miter join, that is computed multiplying the miter value by the stroke thickness. If the length exceeds the maximum value, the Miter join is turned into a Bevel join. This is available for Toonz Vector levels only, and only if the Join option is set to Miter.
注釈
If the tool options bar is too short to display all the tool options, it can be scrolled by using arrow buttons available at its ends.
While Rectangles and Ellipses are defined by a (bounding) box, Circles and Polygons are defined by a center and radius; Polylines can be used to create open or closed shapes by defining a series of lines; Arcs let you set the end points of a curve, and then the bend.
ちなみに
To draw a rectangle or an ellipse:
Click to define the upper left corner, drag, and release to define the bottom right corner. If you press the Shift key while dragging, the shape will be regular, i.e. a square or a circle; if you press the Alt key, shapes will be drawn starting from their center. It's possible to press both keys at the same time.
ちなみに
To draw a circle:
Click to define the center, drag and release to define the radius.
ちなみに
To draw a polygon:
- Set the number of sides in the Polygon Sides: field.
- Click to define the center, drag and release to define the radius of a circle bounding the polygon.
ちなみに
To draw a polyline:
- Do one of the following:
- Click to define the first point as a corner point.
- Click and drag to define the first point as a control point; while dragging you can set the control point handles.
- Do one of the following:
- Click to define the end point of the line as a corner point. If you press the Shift key, you will draw a vertical, horizontal or 45° line.
- Click and drag to define the end point of the line as a control point; while dragging you can set the control point handles.
- Do one of the following:
- Click or click and drag again to define the end point of another line connected to the end point of the previous line.
- Double click to define the last point of an open shape.
- Click or click and drag again on the first point you defined to draw a closed shape.
注釈
Press the Ctrl key to add a linear point after a Nonlinear one.
注釈
Press the ESC key to cancel the creation of the polyline.
ちなみに
To draw an arc:
- Click to define the first end point.
- Click to define the second endpoint.
- Drag to set the bend, and click to draw the arc.
Adding Text
Text can be added by using the Type tool ( ).
).
注釈
It is also possible to work with editable and animatable text in OpenToonz through the use of the Text Iwa effect. For more information, please see Text Iwa .
In the tool options bar you can set the following:
- Font: to be used, taken from a list based on the Operating System default fonts folder.
- Style:, for the chosen font.
- Size:, for the chosen font.
注釈
Already written text can be resized by using the Selection tool (
) (see Editing Drawings ).
- Vertical Orientation, lets you place the text vertically, one letter under another, instead of horizontally.
The current palette Style is applied to the text you type. The palette style can be changed while typing text, thus you can have characters with different styles in the same text editing session (see Editing Styles ).
注釈
For vector levels, as soon as the text is committed, it's converted into vector outlines, and can no longer be edited as text.
ちなみに
To add text:
- Select the Type tool () and click in the viewer where you want to start writing.
- Choose options Font, Style, Size and Vertical Orientation. These options can be changed as long as you are in text editing mode.
- Change the current color Style in the palette, if you want to use more than one style in the same text editing session.
- Click inside the text editing area to change the text insertion point.
- Click outside the text editing area, or select a different tool, to commit the text.
Using the Eraser
The Eraser tool ( ) allows you to partially erase lines, both in vector and raster drawings.
In the tool options bar you can set the following:
- Size sets the eraser size.
- Hardness sets the amount of antialiasing along the eraser border. This is available for Toonz Raster and Raster drawings only.
- Opacity set the opacity of the eraser; passing twice on an area is not considered while performing a single erasing operation, but only when performing different erasing operations. This is available for Raster drawings only.
- Type: has the options Normal, to use the standard eraser; Rectangular, to perform the erasing inside the box you define; Freehand, to perform the erasing inside the area you outline by clicking and dragging; and Polyline, to perform the erasing inside the area you outline by defining a series of lines. In vector drawings, a stroke is erased only if it is fully included in the area you define.
- Mode: has the options Areas, to erase only areas, Lines, to erase only the drawing outline, and Lines & Areas, to perform both the operations. This is available only for Toonz Raster drawings.
- Selective allows you to erase only lines or areas made with the current style. This is available only for Toonz Vector and Toonz Raster drawings.
- Invert performs the erasing on the outside of the area defined with the Rectangular, Freehand or Polyline options. In vector drawings, a stroke is erased only if it is fully outside of the area you define.
- Frame Range allows you to perform Rectangular, Freehand and Polyline erasing on a range of frames, by defining an area in the first and then in the last frame of the range.
- Pencil mode erases lines without antialiasing, that is with jagged edges. This is available for Toonz Raster drawings only.
注釈
If the tool options bar is too short to display all the tool options, it can be scrolled by using arrow buttons available at its ends.
注釈
The Eraser tool () can be automatically selected by using the eraser of the tablet pen.
Converting Raster Drawings to Vectors
Scanned drawings and raster ones, i.e. drawings not based on vectors, can be converted into Toonz Vector levels.
Two main conversion modes are available: Centerline and Outline. The choice between the two modes depends on which conversion best fits your needs.
In Centerline mode a single vector stroke with a variable thickness is generated for each line in the drawing. This means that the converted drawing can be edited like vector-based drawings made directly in OpenToonz, for example you can change the bend of a stroke with the Pinch ( ) or Control Point Editor tools, and the thickness with the Pump tool (
 ).
).
In Outline mode two vector strokes are generated to define each line in the drawing, and areas filled with different colors are separated by a stroke. This means that, for example, to change the bend of a line you have to change the bend of the two strokes defining it, and to change the thickness you have to model one or both strokes defining it. The thickness of all the strokes is set to 0, so that they won’t be visible in the final render.
注釈
Parameters that are not considered necessary by the user can be hidden using the Options button () at the bottom right of the Convert To vector Pop Up.
In Outline mode the following settings are available:
- Accuracy sets how much the vector strokes will follow the shape of the original drawing lines. High values create more precise strokes, but makes them more complex.
- Despeckling removes small spots or marks from the converted images. Its value expresses the size in pixels of the maximum area that has to be removed.
- Preserve Painted Areas, when activated, includes all the colors in the converted level.
- Adherence sets how much smooth curves bend toward full corners.
- Angle sets the angular threshold below which full corners are inserted in the image
- Curve Radius sets the measure of a curve's radius below which it is replaced by a smooth corner
- Max Colors defines the maximum number of colors that are considered in the Raster image and used in the vector one. The value has to be set taking care of the real number of colors used in the Raster image. High values increase the time needed for the conversion. This is relevant for Raster levels only.
- Transparent Color defines the color that has to be set as the transparent background of the resulting vector level. This is relevant for Raster levels only.
- Tone Threshold sets the value of the darkest pixels to be taken into account to detect lines to be converted to vector; for low values only the darkest pixels are considered thus resulting in thinner lines; for high values lighter pixels are considered too, thus resulting in thicker lines. This is relevant for Toonz Raster levels only.
In Centerline mode the following settings are available:
- Threshold sets the value of the darkest pixels to be taken into account to detect lines to be converted to vector strokes; for low values only the darkest pixels are considered thus resulting in thinner strokes; for high values lighter pixels are considered too, thus resulting in thicker strokes. For Toonz Raster levels (TLV files) the process examines only pixels belonging to the lines; for Raster levels it examines pixels of the whole image.
- Accuracy sets how much the vector stroke will follow the shape of the original drawing lines. High values create more precise strokes but makes them more complex.
- Despeckling ignores during the conversion small areas generated by the image noise; the higher the value, the larger the areas ignored.
- Max Thickness sets the maximum vector stroke thickness; if this value is low very thick lines will be converted in two centerline strokes defining the line outline; if this value is high, they will be converted in a single centerline stroke.
- Thickness Calibration Start: and End: calibrates the vector stroke thickness defined according to the Threshold value; a low value will reduce the stroke thickness preserving its integrity. A different value inserted in the Start / End field determines an animation of the thickness along the length of the level.
- Preserve Painted Areas, when activated, preserves all painted areas in Toonz Raster levels (TLV files) and all the areas painted with colors different from the line color in Raster levels.
- Add Border adds a vector stroke along the image border in order to detect also areas bleeding off the image edge.
- Enhanced ink recognition, when activated, allows to vectorize Raster images (such as TGA, TIF, PNG etc...) without antialiasing along the lines. An heuristic is used to recognize lines and painted areas creating a PLI level, where the lines are seen as ink and the painted areas as paint.
It's possible to select the images or the level frames that have to be converted directly in the Xsheet/Timeline.
When a conversion is performed, a new level is created according to the selection you made, and exposed in the Xsheet/Timeline in the next column/layer to that containing the source level. The new file will have the same name of the starting one, but with a PLI extension, and a “v” suffix, and is saved in the +drawings default folder.
注釈
In case a PLI level with the same name already exists, the name of the new file will be followed by a progressive number.
ちなみに
To convert raster drawings into vectors:
- Select the level frames to convert in the Xsheet/Timeline.
- Choose Level → Convert → Convert to Vectors...
- In the dialog set parameters for the conversion.
- Click the Convert button.
Checking the Convert to Vectors Process
At the bottom of the Convert-to-Vectors Settings window a preview area is available to display the drawing selected in the Xsheet/Timeline, as it will be after the conversion according to the defined settings. At the same time it allows you to compare the final result with the original Raster drawing that is displayed on the left side, and to highlight the vector strokes structure by clicking the Centerlines Check button ( ).
).
You can activate or deactivate it, resize it or navigate its content.
If you change any parameter in the Convert-to-Vector Settings, the previewed drawing automatically updates to display how the changes affect the result.
ちなみに
To activate the preview area:
- In the Xsheet/Timeline select the drawing you want to preview.
- Click the Preview button (
 ) in the bottom bar of the Convert-to-Vector Settings window.
ちなみに
To deactivate the preview area:
Click the Preview button () in the bottom bar of the Convert-to-Vector Settings window.
ちなみに
To resize the preview area:
Do any of the following:
- Click and drag the horizontal separator.
- Click and drag the separator toward the window border to hide the preview area.
- Click and drag the separator collapsed to the window border toward the window center to display again the preview area.
ちなみに
To navigate the preview area:
Do one of the following:
- Use the mouse wheel, or the zoom shortcut keys (by default + and - keys) to zoom in and zoom out.
- Middle-click and drag to scroll in any direction.
- Use the reset view shortcut (by default the 0 key) to display preview at its actual size
ちなみに
To activate and deactivate the Centerlines Check:
Click the Centerlines Check button () in the bottom bar of the Convert-to-Vector Settings window.
Saving and Loading Convert To Vector Settings
Convert To Vector settings can be saved as tnzsettings files in order to have different settings for each level and to be loaded back and used in a different scene.
Loaded Convert To Vector settings can also become the default settings for the scene or for the project (see Scene Settings and Project Default Settings ).
ちなみに
To save the Convert To Vector settings:
- Click the Save Settings button (
 ) in the bottom bar of the Convert-to-Vector Settings window.
 - In the browser that opens choose for the tnzsettings file a location and a name, and click the Save button.
ちなみに
To load saved Convert To Vector settings:
- Click the Load Settings button (
 ) in the bottom bar of the Convert-to-Vector Settings window.
 - In the browser that opens retrieve the tnzsettings file you want to load, and click the Load button.
ちなみに
To reset the Convert To Vector settings to the scene default:
Click the Reset Settings button ( ) in the bottom bar of the Convert-to-Vector Settings window.
Changing the Canvas Size
It's possible to change the size of Toonz Raster and Raster levels, in order to increase or decrease the area around the images of a level.
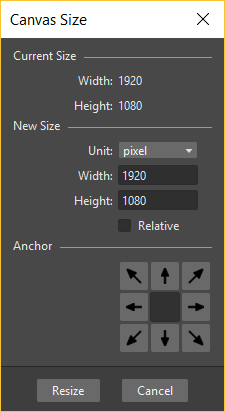
The new size can be set in any unit supported by OpenToonz, by using absolute or relative values. If the canvas is enlarged, some white transparent area is added; if the canvas is reduced, some cropping is applied to the level images.
ちなみに
To change the canvas size:
- Select the Toonz Raster or Raster level you want to modify in the Xsheet/Timeline.
- Choose Level → Canvas Size..., the Canvas Size dialog opens.
- In the dialog set the Unit to express the new size of the canvas, and set the Width and Height of the new canvas; activate the Relative option to define the new size by specifying only the size the canvas has to increase or decrease.
- Use the Anchor diagram to decide the position of the current canvas in the new one: the arrows are a reference to see how the new size will increase or decrease the current canvas size.
- Click the Resize button.
注釈
In case the new canvas size is smaller than the current one, a confirmation dialog will open, asking you whether you want to crop the canvas.
Editing Drawings
Toonz Vector, Toonz Raster and Raster levels, can be manipulated in OpenToonz.
To edit a drawing, for example to copy a part of it, you have first to select it in the Xsheet/Timeline or in the Level Strip. When selected in the Xsheet/Timeline, the viewer displays the whole scene contents at the current frame, when selected in the Level Strip, the viewer displays the selected frame of the current animation level only, to let you work more easily on it.
Drawings can be also selected directly in the viewer: this allows you to work on the different drawings visible at a certain frame with no need to retrieve them in the Xsheet/Timeline or Level Strip.
注釈
All the editing performed on drawings is not saved until you save the related level, or use the Save All command (see Saving Levels ).
ちなみに
To select the drawing to edit:
Do one of the following:
- Select it in the Xsheet/Timeline or Level Strip.
- Right-click in the viewer the drawing you want to edit and in the menu that opens choose the Select command related to the column containing the drawing you want to edit.
注釈
The right-click menu first lists all the columns containing overlapping drawings, then the columns and objects that are hierarchically linked to the clicked one.
Using the Selection Tool
The Selection tool () allows you to edit, move, rotate, scale and distort a selection in a drawing.
In the tool options bar you can set the following:
Type: has the options Rectangular, to select the area of the box you define by clicking and dragging; Freehand, to select the area you outline by clicking and dragging; and Polyline, to select the area you outline by defining a series of lines. In vector drawings, a vector stroke is selected only if it is fully included in the area you define.
Mode: has the options Standard, to select vectors; Selected Frames, to edit all the lines of selected frames at once; Whole Level, to transform all of the drawings of the current animation level; Same Style, to select at once all of the vectors painted with the same style in the current drawing; Same Style on Selected Frames, to select at once all of the vector strokes painted with the same style in the selected frames of the current animation level; Same Style on Whole Level, to select at once all of the vector strokes painted with the same style in all the drawings of the current animation level; Boundary Strokes, to select all the boundary strokes of the current drawing; Boundary Strokes on Selected Frames, to select all the boundary strokes of the selected frames; Boundary Strokes on Whole Level, to select all the boundary strokes of the whole level.This is available for Toonz Vector drawings only.
Preserve Thickness will preserve the original thickness of the drawing vectors while performing resizing operations. This is available for Toonz Vector drawings only.
Scale H and V set the horizontal and vertical scaling of the current selection.
Link will maintain the proportion of the selection while draging over any of the Scale H or V letters in the tool options bar.
Rotation sets the rotation of the current selection.
Position X and Y set a vertical and horizontal offset for the selection.
Thickness sets the thickness of the selected vector strokes. In case the selected strokes have variable thickness, or different thickness values, the highest value is displayed, and any change will affect the other values accordingly. This is available for Toonz Vector drawings only.
Cap: sets the shape of the ends of the selected vector strokes. Options are Butt for squared ends, Round for semicircular ends, and Projecting for squared ends extending beyond the end of the line, according to the stroke thickness. This is available for Toonz Vector drawings only.
A butt cap, a round cap and a projecting cap.
Join: sets the shape of the straight corners along the selected vector strokes. Options are Miter for pointed corners, Round for rounded corners, Bevel for squared corner. This is available for Toonz Vector drawings only.
Miter joins, round joins and bevel joins.
Miter: sets the maximum length of a Miter join, that is computed multiplying the Miter value by the stroke thickness. If the length exceeds the maximum value, the Miter join is turned into a Bevel join. This is available for Toonz Vector drawings only, and only if the Join: option is set to Miter.
Modify Savebox check box allows you to resize the Savebox of a drawing. The drawing part that, because of the editing, falls outside of the savebox will be erased. This is available for Toonz Raster drawings only.
注釈
The Savebox size can be set automatically to the minimum size by activating the Preferences → Drawing → Minimize Savebox after Editing option.
No Antialiasing when activated, the antialiasing is not applied when the selection is deformed or rotated. This is available on Toonz Raster and Raster drawings only.
注釈
If the tool options bar is too short to display all the tool options, it can be scrolled by using the arrow buttons available at its ends.
When a selection is made, it is displayed with a bounding box with handles that allow you to perform the following transformations:
- Move, click and drag the inside of the raster selection, or any selected vector of a vector selection, to move it; by pressing the Shift key while dragging, the movement will be constrained on the horizontal or vertical direction.
注釈
The keyboard arrow keys can be used as well to move the selection one pixel in any direction; if they are used while pressing the Shift key, the movement will be in 10 pixels steps.
- Rotate, click and drag outside any corner handle to rotate the selection.
- Scale, click and drag any corner handle to scale the selection freely; by pressing the Shift key while dragging the scaling will be uniform; by pressing the Alt key the scaling will be applied from the center.
- Scale in one direction, click and drag any side handle to scale the selection in one direction; by pressing the Alt key the scaling will be applied symmetrically from the center.
- Center, click and drag the center handle to change the center of rotation, and the center used when Alt-scaling.
- Distort, Ctrl-click (PC) or Cmd-click (Mac) any corner handle to distort the selection, or any side handle to shear it.
注釈
Ctrl-click (PC) or Cmd-click (Mac) operations are not allowed in Whole Level modes (see above).
- Thickness, click the double arrow-head at the bottom right corner of the selection and drag up to increase the thickness of selected lines, down to decrease it. This option is available for Toonz Vector drawings only.
To apply the transformations you can click outside the selection.
注釈
As you roll over the handles, the cursor changes shape to indicate the operations you may perform.
Selections can also be Cut, Copied, Pasted and Deleted by using the relevant command in the Edit menu. Cut or Copy and Paste also work from one drawing to another, or onto a new one. This allows you to copy or move a section of a drawing to another drawing, or split a drawing into several ones.
When a drawing in a Toonz level, or a section of it is pasted to another one, the Styles of the pasted drawing are added to the palette of the target level, unless the same Styles are already available in the palette.
注釈
The selection can also be used to change the Style of vector strokes by choosing it in the palette, or by creating a new Style while selected. See Editing Styles .
ちなみに
To edit the drawing savebox:
- Activate the Modify Savebox option to visualize the savebox around the drawing.
- Use the handles to resize it.
- Deactivate the Modify Savebox option to confirm the changes.
ちなみに
To select and transform an area in a Toonz Raster or Raster level:
- Select the area by doing one of the following:
- Set the type to Rectangular and click and drag to define the box whose area you want to select.
- Set the type to Freehand and click and drag to outline the area you want to select.
- Set the type to Polyline and click to outline the area you want to select by defining a series of lines.
- Do one of the following to make geometric transformations:
- Operate the handles available along the bounding box.
- Edit the scale, rotation and position values available in the tool options bar.
First define the area you want to select, then use the bounding box to make geometric transformations.
ちなみに
To select and transform vectors in a Toonz Vector level:
- Select the vectors by doing one of the following:
- Click a stroke to select it.
- Shift-click to add a stroke to or remove it from the current selection.
- Set the type to Rectangular and click and drag to the right to define a box and select all the strokes that are completely included in the box; click and drag to the left to select all the strokes that are partially included in the box.
- Set the type to Freehand and click and drag to outline an area and select all the strokes that are completely included in the area.
- Set the type to Polyline and click to outline an area by defining a series of lines and select all the strokes that are completely included in the area.
- Set the mode to Same Style and click to select automatically all the vectors painted with the same style used for the vector you select in the current drawing, or Shift-click to add them to or remove them from the selection.
注釈
When clicking a stroke belonging to a group, the whole group is selected (see Grouping and Ungrouping Vectors ).
- Do one of the following to make a geometric transformations:
- Operate the handles available along the bounding box.
- Edit the scale, rotation, position and thickness values available in the tool options bar.
First select the vector strokes you want to transform, then use the bounding box to make geometric transformations.
ちなみに
To select and transform all the drawings of a Toonz Vector level:
- Do one of the following:
- Set the mode to Whole Level to automatically select all the strokes in all of the drawings of the current animation level.
- Set the mode to Same Style on Whole Level and click to select at once all of the strokes painted with the same style used for the stroke you selected in all of the drawings of the current animation level, or Shift-click to add them to or remove them from the selection.
- Do one of the following to make geometric transformations affecting all of the level drawings:
- Operate the handles available along the bounding box.
- Edit the scale, rotation, position and thickness values available in the tool options bar.
注釈
When working on the whole level the bounding box displayed in the current level drawing is double-lined.
ちなみに
To paste a selection in another existing drawing:
- Make a selection in the current drawing.
- Copy/cut it.
- Select the other drawing in the Level Strip or in the Xsheet/Timeline.
- Paste the copied/cut selection.
注釈
Selections from Toonz Raster and Toonz Vector levels can be pasted in any other type of drawing, automatically converting the pasted selection to the appropriate type; selections from standard Raster levels can only be pasted in other Raster drawings.
ちなみに
To paste a selection in a new drawing:
- Make a selection in the current drawing.
- Copy/cut it.
- Select an empty frame in the level strip or an empty cell in the .
- Paste the copied/cut selection.
ちなみに
To merge several drawings into one drawing:
- Select the area you want to merge and copy/cut it.
- Select the drawing you want to paste the selection to.
- Paste the copied/cut selection.
注釈
Several raster animation levels can also be merged at once by using the related command (see Merging Animation Levels ).
ちなみに
To split a drawing into several drawings:
- Select the area you want to use as a new drawing and copy/cut it.
- Select an empty cell in the .
- Paste the copied/cut selection: automatically a new drawing will be created.
Grouping and Ungrouping Vectors
All the vector strokes of a drawing lie on the same plane, therefore drawing areas are outlined by segments defined by strokes intersections. This means that if you draw two intersecting squares, automatically three areas are defined: one belonging only to the first square, one to the second one, and another defined by the intersection.
Painting a drawing that contains intersecting vector strokes and shapes may be an issue, because all of them lie on the same layer.
To organize strokes you can use the grouping features, that creates a new group entity containing only the strokes you select.
In the case of two intersecting squares, if you want the two squares to be overlapping instead of intersecting, you can create a group containing the strokes of the first square, and another those of the second square, thus defining two groups whose order can be arranged.
It's possible to create as many groups as you want in any drawing; groups can be made of one stroke only as well, for instance a circle, or a line.
First define groups, then set a proper layering order to solve the intersection problems.
When drawing with the Geometric tool (), closed shapes (i.e. rectangles, circles, ellipses, polygons and closed polylines) can be defined automatically as a group by activating the Auto Group option (see Drawing with the Geometric Tool ).
When your strokes selection includes one or several groups, the new group will include them as well, preserving them and their original sorting order position in case the group is released.
注釈
It's not possible to define a group if the selection includes only some strokes belonging to a group.
When a group is released, if no other group is defined in the same drawing, all the strokes will lie at the same plane; if other groups are defined, the strokes of the released group will lie on a plane behind, in front of, or between the other groups, according to the original group sorting order position.
It's possible to enter groups to isolate them visually from the rest of the drawing and better understand which strokes are inside and which outside the group. In this way it's also easier to work on the drawing, for instance to fill an area or to change the color of some strokes.
As the Selection tool () considers the group as a whole, if you want to select a stroke belonging to a group, first you have to enter the group, and then select the stroke.
注釈
As groups define which strokes belong to a certain plane, when using the Fill tool ( ), only areas defined by strokes within the same group can be filled.
ちなみに
To Define a group:
- Use the Selection tool () to select the strokes you want to be in a group.
- Do one of the following:
- Choose Edit → Group → Group.
- Right-click on the selection and choose Group from the menu that opens.
ちなみに
To Release a group:
- Select the group you want to release.
- Do one of the following:
- Choose Edit → Group → Ungroup.
- Right-click on the selection and choose Ungroup from the menu that opens.
ちなみに
To Enter a group:
Do one of the following:
- Select the group, then choose Edit → Group → Enter Group.
- Right-click the group and choose Enter Group from the menu that opens.
- Double-click the group.
ちなみに
To Exit a group:
Do one of the following:
- Choose Edit → Group → Exit Group.
- Right-click the group and choose Exit Group from the menu that opens.
- Double-click outside the group.
ちなみに
To Select a group:
Choose the Selection tool () and do any of the following:
- Click any stroke belonging to the group.
- Click and drag to select at least one stroke belonging to the group.
- Set the type to Rectangular and click and drag to define a box and select at least one stroke belonging to the group.
- Set the type to Freehand and click and drag to outline an area and select at least one stroke belonging to the group.
- Set the type to Polyline and click to outline an area by defining a series of lines and select at least one stroke belonging to the group.
ちなみに
To Select a stroke in a group:
- Enter the group.
- Click the stroke to select it.
Setting Stroke and Group Sorting Order
For each vector drawing, strokes and groups sorting order can be changed by setting what has to lie in front of, and what behind.
Select vector strokes, create groups and set their layering order to better manage the drawing.
ちなみに
To bring the selection to front:
Do one of the following:
- Choose Edit → Arrange → Bring to Front.
- Right-click on the selection and choose Bring to Front from the menu that opens.
ちなみに
To bring the selection one level forward:
Do one of the following:
- Choose Edit → Arrange → Bring Forward.
- Right-click on the selection and choose Bring Forward from the menu that opens.
ちなみに
To send the selection back:
Do one of the following:
- Choose Edit → Arrange → Send Back.
- Right-click on the selection and choose Send Back from the menu that opens.
ちなみに
To send the selection one level backward:
Do one of the following:
- Choose Edit → Arrange → Send Backward.
- Right-click on the selection and choose Send Backward from the menu that opens.
Editing Vector Drawings
Vector drawings can be edited in some additional ways by using the set of tools. This allows you for example to better calibrate the bend of a vector, or to change its thickness.
All these transformations can be also achieved on already painted drawings, because the fill styles used to paint will automatically follow the shape of the areas you modify, working like “liquid” color, flooding an area defined by an outline.
Editing Vector Control Points
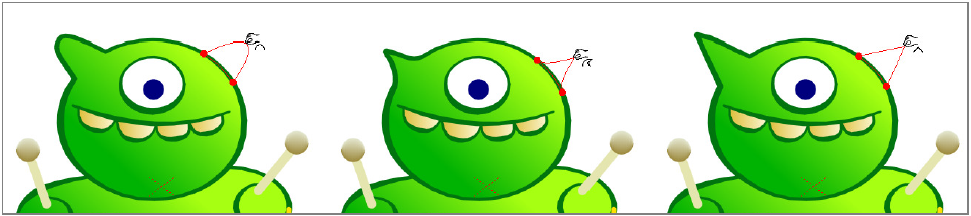
To modify a vector by editing its control points you can use the Control Point Editor tool ( ).
).
Control points have handles whose length and direction define the bend of the vector. With this tool you can select a vector and modify the control point handles, or the bend of a curve defined by control points, and move, add or delete control points.
Control point handles may be linked, that is to say they share the same direction, or not, creating a cusp in the vector; they can also be collapsed in the control point in order to turn it in a corner point. In case only one handle is collapsed, the point will be corner on one side and smooth on the other. When a section of the vector is defined by two corner points, it will be a straight line.
The option Auto Select Drawing is available to automatically select any vector of any drawing visible in the viewer.
Click to select a vector stroke and edit its control points; Alt-click to unlink control point handles; Ctrl-click (PC) or Cmd-click (Mac) the selected stroke to add a control point.
ちなみに
To select a vector:
Click it.
ちなみに
To edit the bend of a vector:
Do any of the following:
- Click and drag the ends of the control point handles.
- Click and drag the curve defined by the control points to edit it.
- Shift-click and drag the curve defined by the control point to edit it by keeping the control points position fixed.
ちなみに
To unlink the control point handles:
Alt-click one of the handle ends and drag.
ちなみに
To link the control point handles:
Alt-click one of the handle ends and drag: the other handle snaps to the direction of the one you are dragging.
ちなみに
To add a control point:
Ctrl-click (Pc) or Cmd-click (Mac) the vector where you want to add a control point.
ちなみに
To select control points:
Do one of the following:
- Click a control point to select it.
- Ctrl-click (Pc) or Cmd-click (Mac) a control point to add it to the selection.
- Click and drag to select all of the control points that are included in the selection area.
ちなみに
To move the selection:
Do one of the following:
- Click any selected control point and drag.
- Use the Arrow keys to move the selection one pixel right, left, up or down.
ちなみに
To delete the selection:
Choose Edit → Delete.
ちなみに
To turn a control point into a corner point:
Do one of the following:
- Alt-click the control point.
- Move the handle ends to the control point, in order to collapse them.
- Right-click the control point and choose Set Linear Control Point from the menu that opens.
ちなみに
To retrieve handles from a corner point:
Do one of the following:
- Alt-click the corner point.
- Right-click the control point and choose Set Nonlinear Control Point from the menu that opens.
Changing the Bend of Vector Strokes
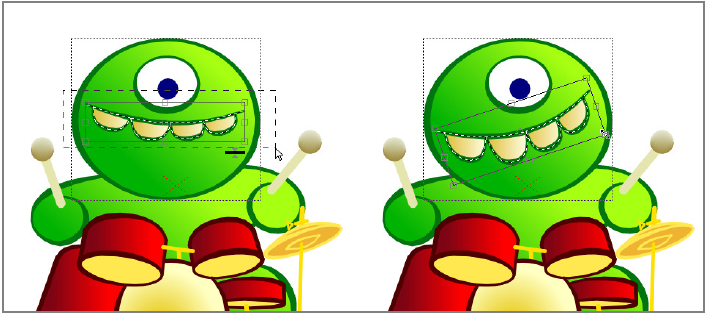
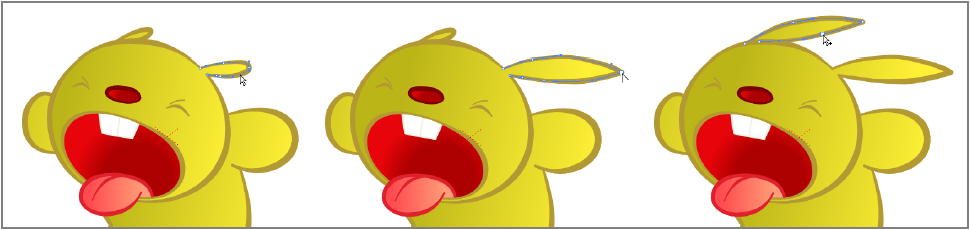
To modify a bend of a vector stroke in a more intuitive way you can use the Pinch tool (). You can use it anywhere you want on the stroke, in order to modify the bend in any direction.
When the tool is selected, a segment of the center line of the closest stroke is highlighted: the segment shows the length of the stroke that will be affected by the pinching.
The length of the segment depends on the corner points, that the tool automatically detects along the stroke, according to the Corner value. It can also be manually set by activating the Manual option, and thus using the Size value to set the affected length.
When the Manual mode is activated, a handle is displayed along the highlighted stroke to control interactively the length of the segment that will be affected by the tool. The handle has a double circle and a square at its ends, that allows you to do the following:
- Double circle lets you move the handle along the segment.
- Square lets you increase the length of the segment affected by the tool by clicking and dragging right, or decrease it by clicking and dragging left.
In both Automatic and Manual modes, different types of editing can be performed when clicking and moving the cursor:
- Click and drag to change the bend of the highlighted segment.
- Shift-click and drag to edit the highlighted segment by adding a cusp.
- Ctrl-click (Pc) or Cmd-click (Mac) and drag to edit the highlighted segment by adding a corner.
ちなみに
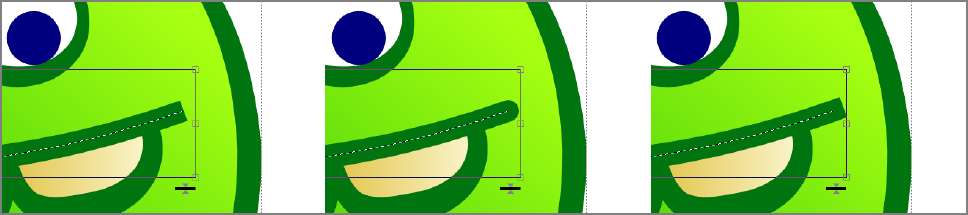
To modify the bend of a stroke:
- Change the length of the segment affected by the tool by setting the Corner value in the tool options bar.
- Click, Shift-click, or Ctrl-click (Pc) or Cmd-click (Mac) and drag to modify the bend of the highlighted segment.
Click and drag to change the bend; Shift-click to add a cusp; Ctrl-click (PC) or Cmd-click (Mac) to add a corner.
ちなみに
To modify the bend of a stroke in manual mode:
- Activate the Manual option in the tool options bar.
- Change the length of the segment affected by the tool by doing one of the following:
- Set the Size value in the tool options bar.
- Click and drag the small square at one end of the handle displayed along the highlighted stroke.
- Click, Shift-click, or Ctrl-click (PC) or Cmd-click (Mac) and drag to modify the bend of the highlighted segment.
ちなみに
To eliminate a corner point from a segment:
- Click and drag the point until the smooth segment is formed again.
- Click and drag to correct the bend of the newly smoothed segment.
Using Other Modifier Tools
To modify the thickness of a stroke you can use the Pump tool (). You can use it anywhere you want on the stroke to increase or decrease the thickness locally. When the tool is selected, a segment of the closest stroke is highlighted: the segment shows the length of the stroke that will be affected by the tool. To modify this length you can change the Size value in the tool options bar.
注釈
It's possible to modify the thickness of a stroke, a stroke selection, or strokes in all of the level drawings, by using the Selection tool () and its related options (see Using the Selection Tool ).
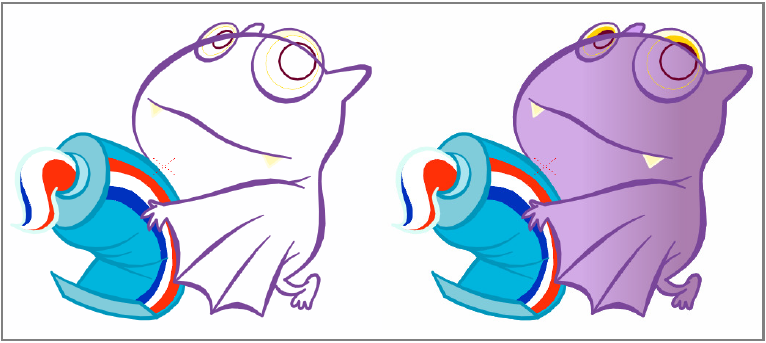
To distort more than one stroke at once, you can use the Magnet tool ( ). The tool affects all stroke included in a circular area and allows you to distort them in the direction of your dragging. Highlighted segments will show the strokes that will be affected. To modify the action range of the tool, represented by a circle, you can change the tool size in the tool options bar.
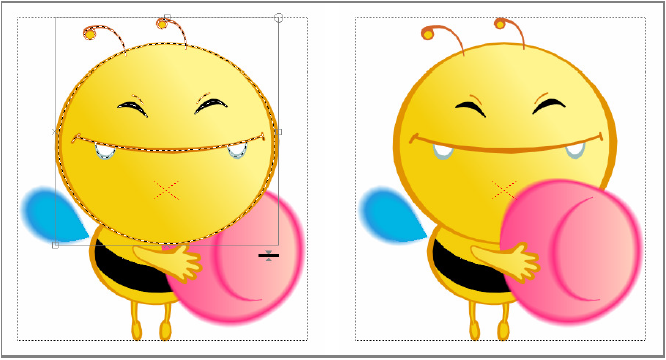
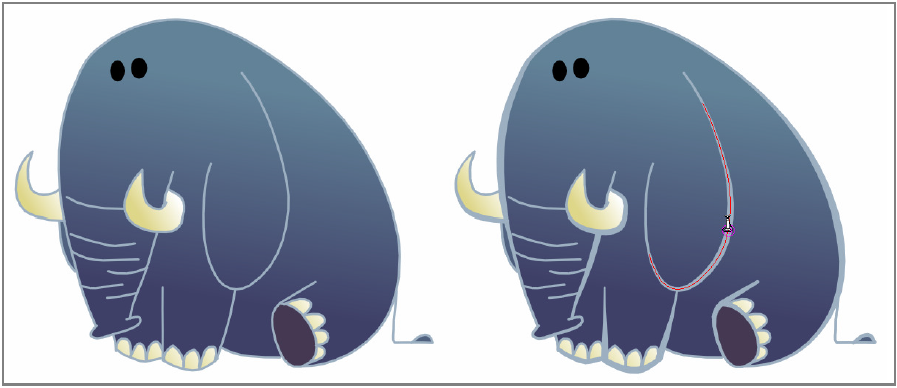
To bend a part of a drawing, for example a character’s arm, you can use the Bender tool ( ). The tool allows you to define a line and then bend all the strokes intersected by the segment. While bending you can see the affected strokes assuming their position after the transformation. The bending can be performed in both clockwise and counterclockwise direction; once you start dragging you cannot change the bend direction.
注釈
If you move the cursor far from the bending center, you will be able to set with more precision the amount of bend you want to apply to the strokes.
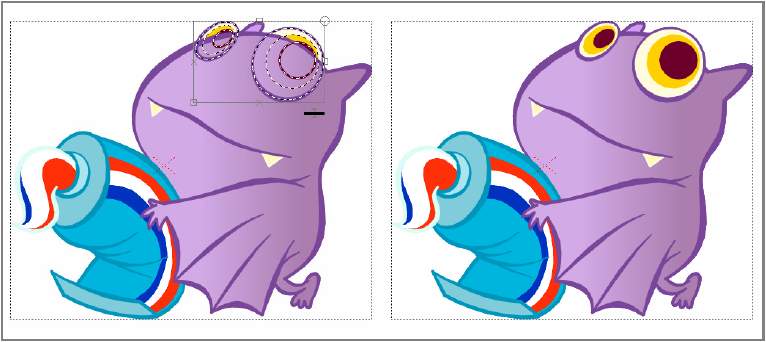
To smooth a stroke, you can use the Iron tool ( ). When used again and again on the same stroke, it increasingly flatten the bends of the stroke. When the tool is selected, the cursor snaps to the closest stroke to indicate where you are going to operate.
ちなみに
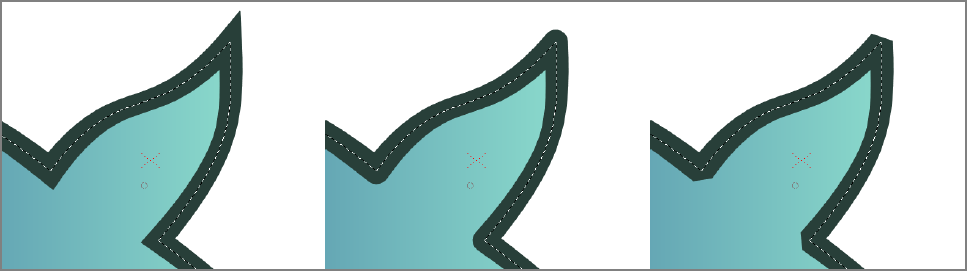
To modify the thickness of a stroke:
- Select the Pump tool ().
- Set the Size: value in the tool options bar.
- Click the point of the stroke where you want to modify the thickness and drag up to increase it, or down to decrease it.
Using the Pump tool to change the thickness of drawn strokes.
ちなみに
To distort several strokes at once:
- Select the Magnet tool ().
- Click in the Viewer: all the strokes included in the circle will be affected by the tool.
- Drag to distort the strokes in the direction of your dragging.
ちなみに
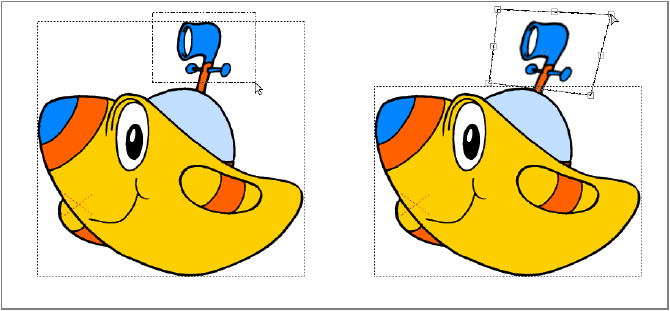
To bend one or several strokes:
- Select the Bender tool ().
- Click on one side of the strokes you want to bend to set the center of the bend.
- Click on the opposite side of the strokes: all strokes intersected by the defined line will be affected by the bending.
- Drag in the direction you want to bend strokes.
ちなみに
To smooth a stroke:
- Select the Iron tool ().
- Click and drag along the stroke you want to smooth. By dragging over and over the stroke will increasingly flatten.
Joining and Splitting
To join the ends of two different vector strokes, you can use the Tape tool ( ). This way it will be possible to handle them as a single stroke, for instance for modifying their bend, or thickness, as a whole.
When the tool is used, the pointer snaps to the closest detected stroke endpoint in order to make the operation easier.
注釈
The Tape tool () can also be used to close gaps along the drawing outline for painting purposes (see Closing Gaps in Drawing Outline ).
To do the contrary, that is to say splitting a stroke in two sections, you can use the Cutter tool ( ).
).
ちなみに
To join two open ends of one or two strokes:
- Select the Tape tool (), and activate the Join Vectors option; activate also the Smooth option if you want a smooth joining with no corners.
- Do one of the following:
- Set the type to Normal and the mode to Endpoint to Endpoint, click a stroke endpoint and drag to a different endpoint; the pointer snaps to the closest detected stroke endpoint.
- Set the type to Rectangular, and click and drag to define a box including the endpoints you want to connect; the endpoints will be automatically joined according to the set Distance value.
注釈
If the strokes you are going to join have different Styles, the Style of the first vector where you click on will be assigned to the second one after joining.
ちなみに
To split a stroke:
- Select the Cutter tool (): the pointer snaps to the closest stroke indicating, with a small highlighted segment, the point where you are going to split the stroke.
- Click to split the stroke at the highlighted point.
Cleaning up Strokes Intersections
Vector strokes intersections may be a weak point in drawings to be painted, because if a gap occurs, drawing areas cannot be painted properly.
The best solution for this kind of issue is to overlap the final section of strokes, in order to define clear intersections, then automatically remove the sections that overflow.
ちなみに
To cleanup vector intersections:
- Use the Selection tool () to select the strokes whose intersections you want to cleanup.
- Do one of the following:
- Choose Level → Optimize → Remove Vector Overflow.
- Right-click the selection and choose Remove Vector Overflow from the menu that opens.
Animation Techniques
Besides drawing frame by frame, one image at a time, until you achieve the animation you want, some other techniques are easier to achieve thanks to OpenToonz features.
Whatever the technique is, you can control your work and how smooth the animation is by using the onion skin, that allows you to view more than one image in the viewer at the same time as reference.
Modelling a Vector Drawing
Instead of animating a level by starting every time from a blank frame, you can duplicate a vector drawing and make subsequent modifications. You can do it even if the drawings are painted, because the styles used to paint will automatically follow the shape of the areas you modify (see Editing Drawings ).
The sequence of the animation level drawings can be easily controlled in the Level Strip.
You can use both the Cells → Duplicate Drawing command and the standard Copy and Paste commands to make a copy of a drawing that you can later modify to create slight movements.
When you use the Duplicate Drawing command, the selected drawing is duplicated in the following frame. If the following frame already contains a drawing, it's shifted down in order to insert the duplicated drawing in the sequence.
When you use the Copy and Paste commands, you can also decide the frame of the Level Strip where you want to paste the drawing.
Once finished, you can make a copy of the modified drawing, and modify it in its turn. You can go on duplicating and modifying drawings until you complete the animation level.
ちなみに
To create an animation level by modelling vector drawings:
- In the Viewer, select a drawing of the vector animation level you want to edit.
- In the Level Strip, select the drawing you want to duplicate.
- Copy the selected drawing in the following frame by doing one of the following:
- Choose Cells → Duplicate Drawing.
- Choose Edit → Copy, then select the following frame and choose Paste.
- Select the new drawing in the Level Strip.
- Use modifier tools to modify the drawing.
- Go on duplicating and modifying drawings until you complete the animation level.
Using the In-betweener with Vector Drawings
An animation technique reserved to vector animation levels is the use of the Inbetween command. Inbetween creates in-between drawings from the two extremes of a range of selected frames in the Level Strip.
When more than two frames are selected in the Level Strip, a vertical strip labeled INBETWEEN is displayed on the right of each frame. By clicking on it, all frames between the first and the last selected, will be overwritten by images interpolating from the first to the last drawings.
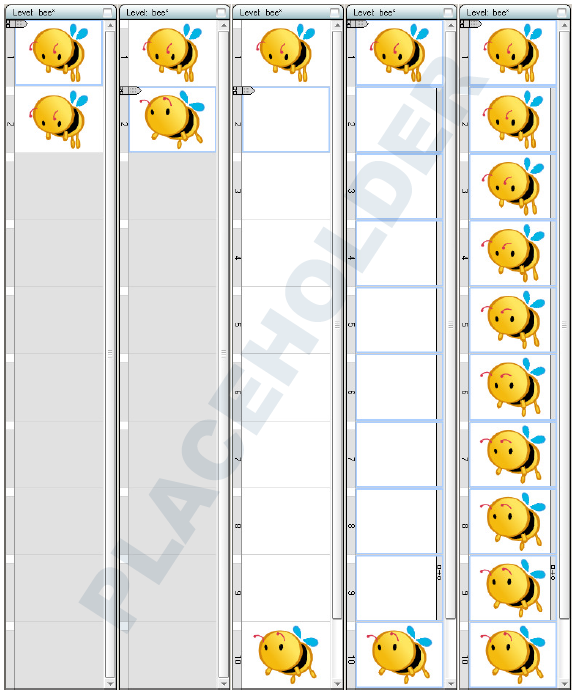
Duplicate a drawing; modify it; insert blank frames; select the frame range, then click the INBETWEEN vertical bar.
The interpolated drawings are created by taking into account the number of the strokes, and the strokes' direction. This means that the result will depend on the way drawings were made. For example if the first image is a single shape drawn clockwise, and the last is another shape, you will get different results depending on the way it was drawn, clockwise or counterclockwise.
To obtain the best results with complex drawings, copy the drawing you want to interpolate from, and paste it in another frame of the level strip. Modify the pasted drawing without adding and deleting strokes, but only distorting and moving existing strokes (see Editing Drawings ). Select the whole range and then perform the interpolation.
The interpolation acceleration can be controlled in the dialog that opens prior to performing in-betweening. Options are the following:
- Linear, for a constant interpolation.
- Ease In, for an interpolation starting slowly, then getting faster.
- Ease Out, for an interpolation starting quickly, then getting slower.
- Ease In / Ease Out, for an interpolation starting slowly, getting faster, then getting slower again.
If you want the interpolation to happen slower or faster, you can insert frames, or cut them, and use the in-betweener again.
ちなみに
To create in-between drawings:
- Select the level where you want to perform interpolation.
- In the Level Strip select the frame range, from the drawing you want to interpolate from, to the one you want to interpolate to. If you want the interpolation to last more frames, make room for more drawings with the Edit → Insert command.
- Click the vertical strip labeled INBETWEEN displayed on the right of the frame range selection.
- Select the Interpolation: mode among Linear, Ease In, Ease Out, Ease In / Esase Out, and click the Inbetween button.
ちなみに
To optimize the in-betweening process:
- Create and paint the drawing you want to interpolate from.
- Do one of the following:
- Copy and Paste it in another frame of the Level Strip, considering the number of in-between drawings you want to achieve.
- Duplicate it and insert as many empty frames as the number of in-between drawings you want to achieve.
- Modify the pasted or duplicated drawing using the modifier tools, to create the final drawing of the interpolation.
- Select the frame range from the drawing you want to interpolate from, to the one you want to interpolate to.
- Click the vertical INBETWEEN strip displayed on the right of the frame range selection.
Rotoscoping
Rotoscoping consists of tracing drawings taking a live clip as reference.
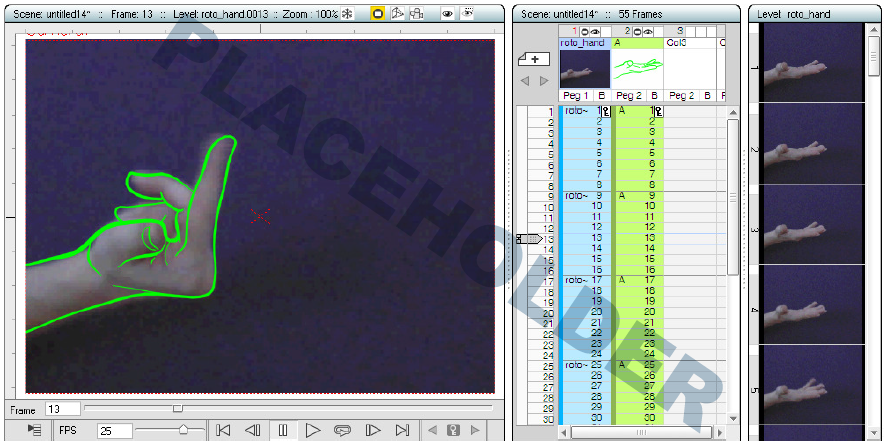
Using the rotoscoping technique to trace the movement of a hand.
As you can import clips and image sequences in a scene, you can simply load them, and create an animation level by drawing in the Viewer, while the frames of the clips are visible underneath. See Using the File Browser .
The way to obtain best results is not trying to reproduce with fidelity the clip, but to use its frames just as a reference to better understand the movement or the transformation of the clip’s subject. In this way you can take advantage, for example, of a natural movement represented in the clip, without renouncing an expressive drawing style.
ちなみに
To perform rotoscoping:
- Load a video clip or image sequence in an Xsheet column (or Timeline layer).
- In the Xsheet/Timeline select a cell in a column on the right of the column (or in a layer on top of the layer) containing the clip you loaded. The image of the clip placed at the same frame of the cell you selected will be visible in the Viewer while you're drawing.
- Create a new animation level and use tools to trace the first drawing in the Viewer.
- Move to subsequent frames, and trace the next drawings.
Cloning Levels
Sometimes it may be useful to create a clone of a level, or a part of it, in order to edit it without affecting the original one. For example you may want to create a new animation level starting from the drawings of another level, in order to have two sequences similar but not identical.
The Clone Cells command allows you to create an independent copy of the selected cells, preserving the numbering order and assigning a new name to it. The _clone suffix appended to the name of the level is the default.
The cloned level will contain only drawings exposed in the selected cells, even if the original level is composed of more drawings; they will be automatically exposed in the column on the right (or layer on top) of the selection, shifting the following columns/layers.
The new level will be available in the Scene Cast as a new element; it will be saved in the +drawings or +extras default folder, according to the format of the original file, as soon as you save it with the Save Level command, or you save the scene.
The cell selection can also spread over several columns/layers: in this case the same number of new columns/layers will be inserted to make room for the cloning result. If more than one level is selected, the same number of new levels will be created and it's not possible to assign a name to the cloned levels.
ちなみに
To clone levels:
- Select the cells you want to clone.
- Choose Cells → Clone Cells.
- Enter a Level Name: and press OK to confirm.
Using Onion Skin
If you want to view more than one level drawing at the same time in the Viewer as reference when you create drawings, or you want to check the animation, you can activate the Onion Skin mode.
The Onion Skin is available both in the Xsheet/Timeline and in the Level Strip, according to where the cursor showing the current frame is displayed, as the onion skin can be activated starting from the cursor and managed in the frame number column/bar.
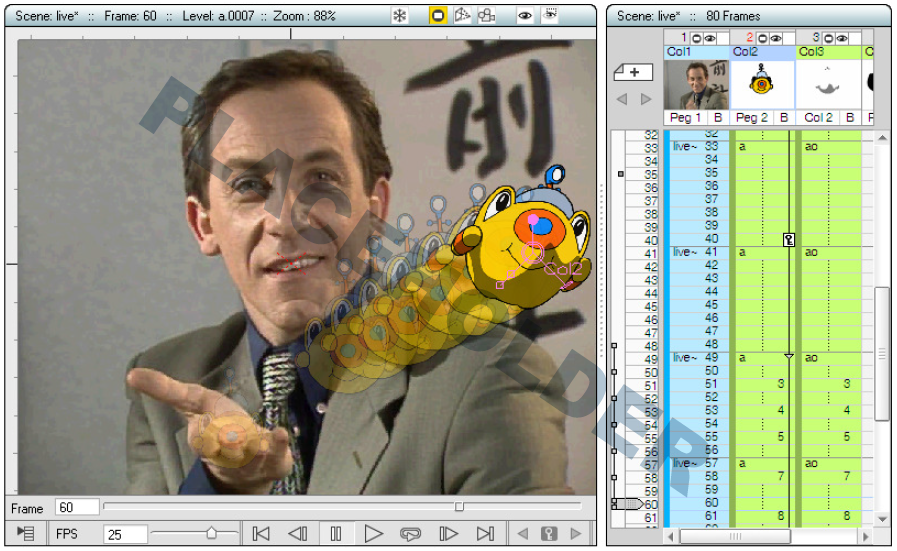
A column animation displayed with the relative Onion Skin set for 6 previous frames, step two, and an absolute Onion Skin set at frame 35.
When a frame of the Level Strip is selected, the onion skin applies to the current level only, referring to the sequence of the full animation level as it was created.
When a cell of the Xsheet/Timeline is selected, the onion skin applies to the current level, according to how the drawing sequence is exposed in the scene, including movements and transformations performed thanks to the object animation (see Animating Objects ), while the rest of the scene in the current frame will be visible as usual. If you want, you can also extend the onion skin to the whole content of the Xsheet/Timeline, to allow references to all of the animated or moving elements in the scene as well.
The relative Onion Skin mode displays frames in relation to the position of the current frame. For instance you can activate the frame previous to the current one, and every time you change the current frame, the previous frame will be displayed.
The fixed Onion Skin mode displays the selected frame independently from the current frame. For instance you can activate frame 5, and every time you change the current frame, frame 5 will be displayed in Onion Skin mode.
The way images are displayed in Onion Skin mode can be customized in the Preferences... → Onion Skin section. It's possible to define the Paper Thickness, to set an independent color correction for previous and following frames, and to Display Lines Only for Toonz Vector and Toonz Raster.
ちなみに
To activate or deactivate frames in Relative Onion Skin mode:
Do one of the following:
- In the Xsheet, click the small romboid markers available to the left of the frames column (or above the frame bar in the Timeline). Click and drag automatically activates or deactivates a series of frames.
- In the Level Strip, click the small circular markers available to the left of the strip frames. Click and drag automatically activates or deactivates a series of frames.
ちなみに
To activate or deactivate frames in Fixed Onion Skin mode:
Do one of the following:
- In the Xsheet, click the small ghosted romboid markers available to the very left of the frames column (or above the frame bar in the Timeline). Click and drag automatically activates or deactivates a series of frames.
- In the Level Strip, click the small ghosted circular markers available to the very left of the strip frames. Click and drag automatically activates or deactivates a series of frames.
ちなみに
To Deactivate (or Activate again) the Onion Skin mode:
Do one of the following:
- Double-click over the big circle to the left of the current frame cursor. Double-click again to activate it back.
- Right-click in the Viewer or in the frames column/bar of the Xsheet/Timeline, and choose Deactivate Onion Skin or Activate Onion Skin in the menu that opens.
注釈
The first time you activate Onion Skin mode by Right-clicking in the Viewer or the Xsheet/Timeline frames column/bar, a default relative onion skin mode activates, showing the previous three frames.
ちなみに
To Extend the onion skin to the Whole Scene Content:
- Activate the onion skin in the Xsheet/Timeline.
- Right-click in the Viewer or in the frame column/bar of the Xsheet/Timeline, and choose Extend Onion Skin to Scene from the menu that opens.
ちなみに
To Limit the onion skin to the Current Level:
Right-click in the Viewer or in the frame column/bar of the Xsheet/Timeline, and choose Limit Onion Skin to Level from the menu that opens.
ちなみに
To customize the way images are displayed in onion skin mode:
- Choose File → Preferences... → Onion Skin.
- Do any of the following:
- Set a value for the Paper Thickness parameter; the lower the value, the more transparent the drawings displayed in Onion Skin mode will be.
- Use the Previous Frames Correction to set a color for displaying previous frames.
- Use the Following Frames Correction to set a color for displaying following frames.
- Activate the Display Lines Only option to display Toonz Vector or Toonz Raster levels with lines only.
Using Shift and Trace
The Shift and Trace function can help you in the creation of animated levels as if you were drawing on paper using a light table; in fact it allows you to use the previous and next key drawings as references, while you insert an inbetween or a break down.
It's possible to temporary move and rotate the drawings you want to use as reference, to fit the position where you want to draw the inbetween. It's also possible to automatically set the position of the reference drawings creating and editing a path of action line.
To better check the new drawing and the animation, you can toggle the Shift and Trace visualization on or off the Viewer.
ちなみに
To enter the Shift and Trace view:
- Position the frame cursor on the frame where you want to draw the inbetween drawing.
- Enable View → Shift and Trace; the previous and next drawings will be visualized.
ちなみに
To Edit the Position of the reference drawings:
- Position the frame cursor where you want to draw the inbetween drawing and sketch the path of action line beteween your reference points.
- Activate View → Edit Shift.
- Click on the drawing you want to reposition in the Viewer, or use the Previous Drawing / Following Drawing options in the tool options bar; the related reference drawing bounding box will be displayed.
- Do any of the following:
- Click and drag inside the bounding box to move the reference drawing.
- Click and drag outside the bounding box to rotate the reference drawing.
- Click and drag the center handle to change the center of rotation.
- Click and drag any corner handle of the bounding box to scale the reference drawing from its center.
- Repeat the same steps on the second reference drawing.
ちなみに
To automatically Edit the Position of the reference drawings:
- Position the frame cursor where you want to draw the inbetween drawing and sketch the path of action line beteween your reference points.
- Activate View → Edit Shift.
- Ctrl-click and drag to create a path, from the reference point in the first drawing, to the reference point in the second one. The starting and the ending points will be overlapped at the center of the path.
- Click and drag the handle along the path to change its shape; the reference drawings will move according to the handle position and rotate according to the path shape modification.
- If needed, use the bounding box handles to fix the rotation of the reference drawing.
注釈
Clicking and dragging one of the reference drawings will remove the path of action line.
ちなみに
To Toggle the Shift and Trace visualization:
Activate View → No Shift to toggle the visualization of the reference drawings back to their original position.
ちなみに
To Reset the position of the reference drawings:
Choose the View → Reset Shift command.
ちなみに
To Reset the transformations of one of the reference drawings:
In the tool options bar click on either Reset Previous or Reset Following buttons.
ちなみに
To Create an inbetween drawing using the Shift and Trace feature:
- Create the first key drawing.
- Create the second key drawing.
- Select the cell where you want to create the inbetween drawing.
- Activate View → Shift and Trace.
- Sketch the path of action line beteween your reference points.
- Activate View → Edit Shift and edit the position of the reference drawings.
- Create the inbetween drawing.